“Fifty percent of all marketing works, the problem is that nobody knows which fifty percent.” –– UNKNOWN

After over 3 years of conversion reporting, new tools and technologies have gained widespread acceptance with home buyers. Also in this period of time, builders’ needs have evolved, requiring data that enable them to prioritize spending on these technologies.
In order to accomodate this, the study has expanded to include important new technologies, prioritized ranking for tools and content, and new demographic profiles.
As a result, much of the historical data can not be included on the charts, since the questions and demographic profiles are not the same as previous years. However, the authors of the study believe it a worthy trade-off to have the newer, more applicable information for builders and marketers to use.
NEW TECHNOLOGIES
As technologies have emerged and evolved, some have begun to change the new home buying and building experience. The following have been significant enough for inclusion in this year’s report, including:
- Interactive feature changes
- Virtual design center
- 3D interactive tours
- Virtual reality tours
TOP-RANKED TOOLS AND CONTENT
In some cases, multiple tools or content were considered equally influential to many buyers. In order to give builders better information for prioritizing budgets, the study incorporates rank data to give deeper insight into what is MOST important or influential to buyers.
NEW DEMOGRAPHIC PROFILES
As Millennial home buyers have become a major force in the industry, the demographic profiles within the report have been adjusted to better align with generational attributes:
- Millennials (age 18-36)
- Generation X (age 37-51)
- Baby Boomers and up (age 52+)
These new profiles can be found on the following page, as well as in the demographic break-downs for each question of the study.
AUDIENCE DEMOGRAPHICS
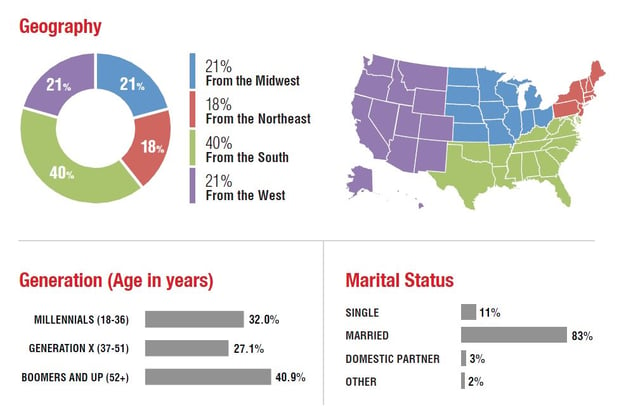
The study focused on recent new home buyers throughout the United States. The largest number (40%) of respondents were from the South, as indicated in Fig. 1 below. The majority of buyers (83%) stated they were married at the time of the survey.

Audience highlights:
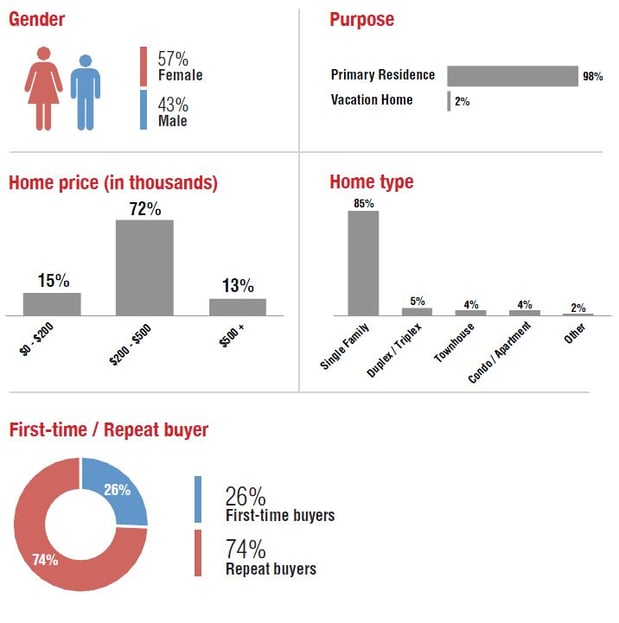
- 74% were repeat buyers, 26% first-time buyers, 83%
were married - 85% purchased single family homes
- 57% female, 43% male respondents
- 87% purchased homes under $500,000
- All respondents were qualified as being involved in the decision-making process of the home purchase.

Learn more about us:

