
You might be tempted to sit back and relax once your campaign has launched. But in order to understand how your campaign is performing (and how you could potentially improve it) you should monitor key campaign metrics in an analytics tool like Google Analytics.
So, what metrics should you be paying attention to?
Here are the basics:
• Views: how many people have checked out your landing page
• Downloads/registrations: how many people lled out your landing page form in
order to download content/register for an event
• New contacts: how many new contacts has the campaign added to your database
• Conversion rate (downloads/registrations): % of landing page visitors who end up downloading content/registering for an event
• Conversion rate (new contacts): % of landing page visitors who download content/ register for an event and become new contacts as a result
|
• Ensure that your landing page is mobile-optimized (learn more). • Use target keyword(s) in the page title. • Keep the URL structure clean. For example: o er.yourwebsite.com/free-marketing-guide = good o er.yourwebsite.com/id=4673007niner/free-marketing-guide-07-17-15 = bad • Write a compelling meta description. (Note: this won’t a ect rankings, but it can help encourage searchers to click on your website’s result, so make it count!) |
|
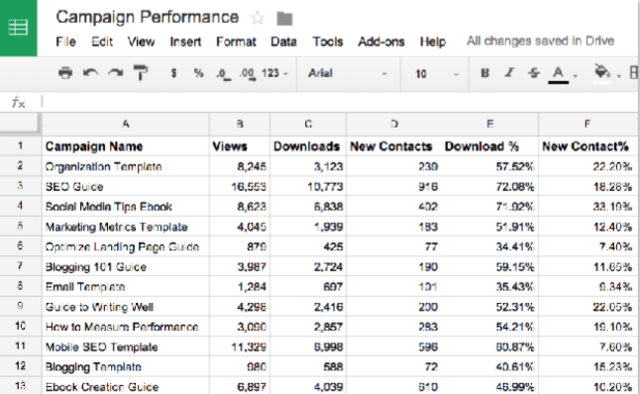
In order to compare the performance of two or more campaigns, establish and stick to a speci c time duration that you can use for all of your measurements. For example, if one campaign launched last January and another launched last March, comparing their total views, total downloads, etc. would be misleading: the rst one’s had more time to perform. To account for this, simply decide on a timeframe (for example, from a campaign’s launch date to 2 weeks after launch) and use that for every metric you calculate. Sound a bit complicated? At HubSpot, we’re able to keep tabs on all of our campaign metrics with the help of Google Sheets. Here’s a mock-up of what one of our quarterly campaign performance spreadsheets might look like:
|
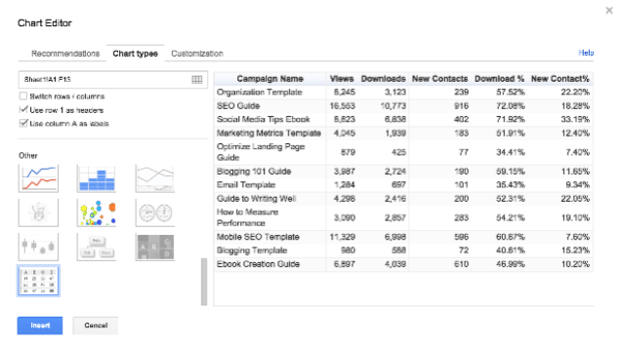
Need to present your ndings to a coworker or third party? Select your data and use Google’s Chart Editor (Edit > Insert > Chart) to create a chart, graph, or other visualization.
|
Once a campaign has launched and you’ve collected data on its performance, it’ll be time to run a “post-mortem’ meeting with your coworkers and collaborators. You can do this in-person, via Google Hangouts or Gmail, or even in a Google Doc that everyone can update or comment on. Here are some of the questions you should answer and explore: |
|
• Which sources (organic, paid, social?) drove the most tra c to your campaign’s landing page? • Which sources drove the most-quali ed (i.e., most likely to convert) tra c? • Which sources drove the least amount of/least-quali ed tra c? • If you were able to launch the campaign again, what would you do di erently? What would you do the same? |

N5R.ai
North America's Leading HubSpot AI Agency
AI Strategy • HubSpot AI • Agent Architecture • AI Transformation
N5R.ai • WisdomClone.ai • 10X AI News • Strategic AI Coach
Ready to Become AI-First?
N5R.ai is North America's #1 HubSpot AI Agency.
Book Your Free 15-Min AI Strategy Session
It's Not The Market. It's Your AI Marketing.
www.n5r.ai · 10X AI News · WisdomClone.ai
© 2026 N5R.ai · Toronto, ON
